On Monday I posted that I thought President Obama had put up his best polling day. Looks I should have waited and called it his best polling week. I look at the polls each day and all I see is blue.
I'm working on a 4 day actuarial take-home exam so posts will be sparse but I'll update the map and numbers at least once/day.
Friday, September 28, 2012
Tuesday, September 25, 2012
Election Model: Ohio and Virginia
Brief update notes:
Ohio and Virginia
The other day Nate Silver tweeted the following:
Today I decided to see just how OHVA the election would be if Mitt Romney lost both of those states.
I had the model keep track of how often Mr. Romney lost both Ohio and Virginia, how often he won at least one of those two states, and how he fared nationally in those two scenarios. I came up with the following:

It does appear that if Mitt Romney lose both OH and VA the election is effectively over, he manages to overcome that deficit less than 1% of the time. There is good news for Mitt, if he does manage to win one (or both) of those states.
60% of the times Mitt Romney wins at least one of OH or VA, he also wins the election. The catch is, the model also gives him just a 16% chance to win one of those states..
It is important to remember the causality runs both ways here. swinging Ohio's 18, or Virginia's 13 electoral votes helps Mitt in the electoral college. Simulations where Mitt Romney wins one of OH or VA are, on average, simulations where he is doing better nationally and is likely contesting other key states like FL or MI.
If I did this same kind of analysis on say, F and MI, I would expect a similar kind of story. You can't make those into a cool pun though... MIFL?
- I added a metric measuring President Obama's chances of exceeding his 2008 electoral vote total. They aren't good. He won Indiana in 2008 and his chances of repeating that feat are.. slim.
- Arizona moved from safe Romney to likely Romney. This is the combined effect of a weak recent poll for Romney in AZ (+3 on 9/19) and the dropping completely out of an older stronger poll for him. (Ras +13 on 6/26)
Ohio and Virginia
The other day Nate Silver tweeted the following:
If Obama wins both Ohio and Virginia, the election is OHVA
— Nate Silver (@fivethirtyeight) September 20, 2012
Today I decided to see just how OHVA the election would be if Mitt Romney lost both of those states.
I had the model keep track of how often Mr. Romney lost both Ohio and Virginia, how often he won at least one of those two states, and how he fared nationally in those two scenarios. I came up with the following:

It does appear that if Mitt Romney lose both OH and VA the election is effectively over, he manages to overcome that deficit less than 1% of the time. There is good news for Mitt, if he does manage to win one (or both) of those states.
60% of the times Mitt Romney wins at least one of OH or VA, he also wins the election. The catch is, the model also gives him just a 16% chance to win one of those states..
It is important to remember the causality runs both ways here. swinging Ohio's 18, or Virginia's 13 electoral votes helps Mitt in the electoral college. Simulations where Mitt Romney wins one of OH or VA are, on average, simulations where he is doing better nationally and is likely contesting other key states like FL or MI.
If I did this same kind of analysis on say, F and MI, I would expect a similar kind of story. You can't make those into a cool pun though... MIFL?
Monday, September 24, 2012
Election Model: Obama's best polling day
Perhaps Obama's best polling day. Excellent outcomes in every swing state including a +4 in North Carolina. With today's polling in there the model now gives him a 90% chance to win. Update on its way...

Thursday, September 20, 2012
Election Model: Methodology Update
I've made a small improvement to the precision with which variance in the national simulation is calculated. It now more accurately reflects the sample size of the RCP national polling average. As a result variance has slightly increased, which is good for the underdog i.e. Romney.
In spite of this change, President Obama's win probability continued to increase thanks strong polling the last few days, particularly in Wisconsin (now 93% to go for Obama), Michigan (92%), Ohio (90%), and Virginia (87%).
538s Senate forecast is up here, and I just learned today about a cool looking model for forecasting the House here.
Tuesday, September 18, 2012
Election Model: Important Swing States
The data indicate the FL may be the most important state to Mitt Romney. Just 4% of Mitt Romney’s electoral college victories come without a victory in Florida. For President Obama the data are more subtle. The president has many more paths to victory without florida than Mitt Romney, but he can almost lock up a win by locking up Florida.
The question of which swing state is the most important is difficult to answer. I considered at least 4 approaches:
Options 3 and 4 are too simple, and don't allow for ranking states. They are too blunt a hammer with which to approach this problem.
Options 1 and 2 do (sort of) allow for ranking of states, and allow for a more complex view of the problem in general. Option 1 is more sensitive to national outcome probabilities (saying Romney wins 10% of the time when he wins State A is different than saying Obama wins 10% of the time when he wins state A since Romney only wins 15% of the time).
For this reason I prefer option 2, which allows a more direct comparison on how important each swing state is to each campaign. I've excluded non-swing states. Obama wins 0% of elections where he loses Vermont, but it's obviously to everyone that if he's losing Vermont he's in big trouble. The same goes for Romney and, say, Georgia.
Below are all 12 states not currently categorized as safe Obama or safe Romney, ordered by how likely Obama was to win in the most current simulation. For each combination of state and candidate the numbers presented are: If the candidate wins the presidency, how likely are they to have done it without winning the given state.
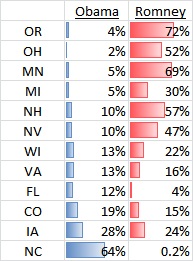
In 12% of the simulations where Obama won, he won despite having lost Florida. In 10% of them he won despite having lost Nevada.
There is more subtlety to this data. The numbers shown, how likely is [candidate] to win the presidency without the help of [state] are inversely correlated with a candidate’s odds of winning that state (0% of Mitt Romney wins include a victory in New York where he can’t win, 100% of them include a victory in Utah where he will win).
States who deviate down from that general trend stand out. They are states where a candidate's paths to victory without that state are fewer than his overall chance to win the state would indicate. Under this principle Ohio and Florida stand out as important for both candidates while Michigan appears important to Mitt Romney. Lastly, Iowa looks unimportant.
This data seem to tag Florida as the most important swing state. Just 12% of Obama victories come without Florida, and just 4% of Romney victories are Florida free.
The question of which swing state is the most important is difficult to answer. I considered at least 4 approaches:
- How well does a candidate do when they win a given state (President Obama wins 92% of the time he wins Ohio)?
- How likely is a candidate to, when he wins, win while simultaneously losing a given state? (When President Obama does win, 2% of those wins include winning Ohio)?
- Which state is the closest to a toss-up? (Iowa at the moment)
- Which state is most likely to put each candidate over 270 electoral votes (Wisconsin at the moment)
Options 3 and 4 are too simple, and don't allow for ranking states. They are too blunt a hammer with which to approach this problem.
Options 1 and 2 do (sort of) allow for ranking of states, and allow for a more complex view of the problem in general. Option 1 is more sensitive to national outcome probabilities (saying Romney wins 10% of the time when he wins State A is different than saying Obama wins 10% of the time when he wins state A since Romney only wins 15% of the time).
For this reason I prefer option 2, which allows a more direct comparison on how important each swing state is to each campaign. I've excluded non-swing states. Obama wins 0% of elections where he loses Vermont, but it's obviously to everyone that if he's losing Vermont he's in big trouble. The same goes for Romney and, say, Georgia.
Below are all 12 states not currently categorized as safe Obama or safe Romney, ordered by how likely Obama was to win in the most current simulation. For each combination of state and candidate the numbers presented are: If the candidate wins the presidency, how likely are they to have done it without winning the given state.
In 12% of the simulations where Obama won, he won despite having lost Florida. In 10% of them he won despite having lost Nevada.
There is more subtlety to this data. The numbers shown, how likely is [candidate] to win the presidency without the help of [state] are inversely correlated with a candidate’s odds of winning that state (0% of Mitt Romney wins include a victory in New York where he can’t win, 100% of them include a victory in Utah where he will win).
States who deviate down from that general trend stand out. They are states where a candidate's paths to victory without that state are fewer than his overall chance to win the state would indicate. Under this principle Ohio and Florida stand out as important for both candidates while Michigan appears important to Mitt Romney. Lastly, Iowa looks unimportant.
This data seem to tag Florida as the most important swing state. Just 12% of Obama victories come without Florida, and just 4% of Romney victories are Florida free.
Saturday, September 15, 2012
Election Model: Overview
I developed a way to simulate elections (including state and
national outcomes) using just two key pieces of information: polling average
(both state and national), and how many days until the election. I simulate a lot of elections and see how things play out on average.
My source for most of my polling data is Real Clear Politics. They do excellent work in collecting polling data and also calculate their own poll averages. For national
polling I currently use their average.
For individual states I do my own calculation based on a
weighted average of polls. Newer polls are given more weight than older polls,
bigger polls are given more weight than smaller polls, and likely voter polls are
given more weight than registered voter polls.
For both national and state polls I estimate a confidence
interval around the number – given what we know is the current poll how far
could the real results actually stray from that poll. In a state with little
polling that could be 5-10 points in either direction, in more heavily polled
states the ranges are narrower. In short, the more polling data I have,
the more confident I am.
This information (what we know about the race in each state,
what we know about the national race) is fed into the model which uses it to
simulate a national election. I repeated the simulation many times, and report
out the aggregate results. Some examples in the 9/13 simulation:
- · President Obama won 84% of the time
- · He won the popular vote in Wisconsin 78% of the time
- · He won the popular vote in Indiana 2% of the time
- · There was an electoral college tie 0.2% of the time
- · 91% of the time, the winner of Michigan was the same as the winner of the election overall.
The simulation is repeated many times because although the
model doesn’t know what will happen, it does know how likely various outcomes
are. Perhaps the right mix of voters will turnout for Romney in OH and FL, or
perhaps a different mix turns out and Obama wins both states. Perhaps something
will happen that swings the election dramatically in Romney’s favor. The model
doesn’t know which will happen, but it can estimate how likely each of these
events are. You have to repeat that simulation many times to capture all the
possible realities and see how they play out together, on average.
If you who are craving a more detailed explanation
(including more detail on confidence intervals, translating voting advantages
into winning percentages, and much more), please see Intro, and National Sim entries.
Friday, September 14, 2012
Election Model: Most Likely Outcomes
After my last simulation I was curious - for each candidate, how are they most likely to win?
According to the model, this is the most common electoral map in the event of an Obama victory. If Obama wins, there's a 20% the win will be with this exact electoral map.
 |
| Most likely outcome if President Obama wins
According to the model, this is the most common electoral map in the event of an Romney victory. If Romney wins, there's a 20% the win will be with this exact electoral map.
|
 |
| Most likely outcome if Mitt Romney wins |
Election Model: National Simulation
Simulating National Outcomes
Variance is more difficult and I've struggled with it. I ultimately decided
on the following. Using the calibrated logistic function I believe I've arrived
a way of translate polling advantage, sample size, and distance to the election
into a reliable winning percentage in a way that is cognizant of the 3 primary
sources of error. In calculating the appropriate variance to use I leverage
that calculation. Given that I know an average polling outcome (say, Obama +8.9
for Connecticut) and the probability Obama wins that state (if the state
election were an independent event) in this case 98.67%. Using those two
numbers I can calculate an implied polling standard deviation (4.02% in the
case of CT
The detailed outcomes from my 9/13 simulation are below.

National Elections are
more about a national message than high variability in any given state. I
simulate a national outcome first, then simulate individual state outcomes
based on both the national outcome and how each individual state tends to perform
relative to the national outcome (for example, Vermont currently looks 17
points better for Obama than the national outcome, Alabama looks 21 points
worse). Simulating in this manner ensures that states tends to move together
with the national outcome, but are allowed to vary individually.
Each individual election
is simulated by drawing a random sample from a normal distribution, then the
results are aggregated to give summary statistics (for example, Obama won the
Electoral Vote 84.1% of the time the last time I ran 25,000 simulations). The
mean and variance of the distributions are calculated as follows:
The mean is based on polling average. For national
outcomes the mean is simply the current polling average. For state outcomes it
is the national poll average + the state adjustment (+17 for Vermont, -21 for
Alabama).
The detailed outcomes from my 9/13 simulation are below.

Election Model: 538
I've used several good ideas from Nate Silver's blog, located here. Some of them are:
I also do some things differently.
- Some of the outcome analysis (win electoral lose popular, blowout)
- The idea that registered and likely voter models should be treated differently.
- The idea to display electoral vote outcomes in a histogram. This might be my favorite idea of his, it's a great way to visualize the electoral picture.
I also do some things differently.
- I underweight registered voter polls, I don't adjust them. Early on likely voter models are difficult to calibrate (quick, predict in may who will vote in november). As the election draws near they get better and better. Instead of keep tracking of LV vs. RV aggregate results and adjusting accordingly, I just underweight the RV polls, more and more until they have no weight right before election day.
- I don't adjust for house effects. I understand the desire and am even willing to consider that it might be a more complete approach, but I think those effects will tend to wash mostly out as sample size increases and adjusting too much for house effects leaves you in danger of overfitting.
- When there is enough polling in a state to yield a sufficient sample, the model only considers aggregate poll sample size, aggregate poll outcome, and time to the election. When there is insufficient poling data I fill in the blank with the Cook's PVI value (I don't know the details behind 538s state fundamentals but I think these two ideas are similar in nature). I believe 538 introduces unnecessary complexity by including economic data. I have a hard time imagining such data adding information not already captured by polling.
Thursday, September 13, 2012
Election Model: Introduction
Introduction
Back in early June, I got tired of waiting for Nate Silver to release his own election model so I started building my own. I don’t do this for a living and have new baby, full time job, part time other job and hence limited time. However using the 80/20 principle I initially found a good intuitive way to use aggregate polls and estimate each candidates’ chance of winning one of a dozen swing states, then expanded to include all states.
The model is informed only by polling data (taken from RCP) and how far away we are from the election. Attempting to include economic or demographic data would result in a lot more work without much more added value since that information is already captured in polls.
I use a logistic model to translate aggregated polling data into likelihood of winning for each state. The shape of the logistic graph is informed both by how far we are from election day and how much polling has gone on in a state (the curve gets sharper with more polling data and the closer we get to election day).
State Poll Aggregation:
I calculate the poll average weighting each poll by age and sample size. Older smaller polls are less meaningful. At the state level sample size weights work linearly, a 1000 person poll is weighted twice as much a 500 person poll. Age weights work on a half life of 30 days (this may need to chance as the election draws near). A poll from today counts twice as much as a poll from 30 days ago which counts twice as much as a poll from 60 days ago. There is also a distinction between likely and registered voter polls. Early on they were treated roughly the same, but as the election draws near the registered voter polls are weighted less and less until finally on election day they are not included.
The logistic which translates a polling edge into a state winning % is sensitive both to sample size an time to the election. For example a state with little polling and might have a logistic shaped like
While a more polled state might look like:
The logistic function is calibrated as follows. Polls currently conducted have two main sources of error:
1) The poll sample doesn’t necessarily represent the population (sample size)
2) The poll doesn’t know what will happen between now and election day (cone of uncertainty)
Error source #1 can be calculated. I discount polls against what we have defined as a full sample (10k) using the square root of the ratio of the sample / 10,000 (quite a bit went into selecting square root ratio over log-ratio or standard ratio if anyone is interested).
Quantifying the error from Source #2 is more difficult. The currently model assumes a linear flow of information (we learn, on average, as much going from 60 to 59 days out as we do from 9 to 8 days). We then calibrated the logistic using the assumption that a candidate who is 1 point down in a state in a full 10k sample when the poll was initially completed (5/29) had a 45% chance to win that state.
Subscribe to:
Posts (Atom)