Goal differential is Goals Scored minus Goals Conceded. Let's take the USA#1 as an example:
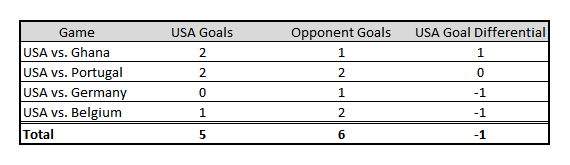
For the whole tournament, the model predicted the USA would have a goal differential of -2.5. By coming in at -1, the USA out performed the model's expectations by 1.5 goals (WOOHOO USA#! etc).
How did the rest of the field do?
- Netherlands and Germany have both been over 8 goals better than the model expected (and Germany still has one game to go)!
- Some of the fun positive surprises (Costa Rica, Mexico) jump out at the top of the list, and of course the wild disappointments (Spain, Portugal) sit near the bottom
- Brazil being in last is a function of them having a very high positive expected goal differential and (of course) them having given up 10 goals in their final two games
- This isn't an absolute ranking of teams, but a ranking of how teams have performed relative to expectations

No comments:
Post a Comment